Matlab Examples
Matlab is a program by The Mathworks for scientific computing.
Outline of Contents
Plotting Points in 3-Space
scatter3 lets you make a scatter plot. You can specify the color and point size for each point.
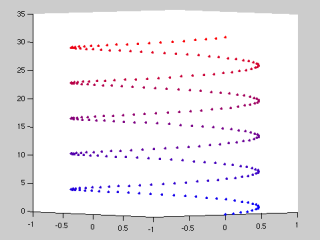
The above helix was plotted using graphHelix.m:
function graphHelix
t=linspace(0,10*pi,255);
% make t a column vector
t=t(:);
% display in a new window
figure
% to fade between two colors, we take a convex combination of the two
red=[1 0 0];
blue=[0 0 1];
x=sin(t);
y=cos(t);
frac=t/(10*pi);
color=frac*red+(1-frac)*blue;
scatter3(x,y,t,30,color,'filled');
end
Saving Animations
The following function, makeAvi.m rotates the current 3-d image and saves the rotation as a .avi file. The .avi file will be quite large, but you can then encode it into other formats. Here, for example, I encoded it into a .flv file.
% makeAvi(filename,rotations)
%
% makes an avi of the current 3d figure being rotated 360 degrees
% rotations times. If no filename is specified, uses output.avi
function makeAvi(filename,rotations)
if nargin<1
filename='output.avi';
end
if nargin<2
rotations=1;
end
% fix aspect ratio
axis vis3d;
% create file
movie=avifile(filename,'fps',30,'compression','none');
for i=1:(360*rotations)
view([i 10]);
drawnow;
disp(sprintf('%d',i));
movie=addframe(movie,gcf);
end
movie=close(movie);
end
Matlab Events
The function odeEventDemo.m demonstrates numerical integration with events in Matlab:
function odeEventDemo(tStop)
if nargin
<1
tStop=20;
end
y0=0;
[t,y]=integrateWithEvent(@theOde, 0, tStop, y0, @myEvent, @myOnEvent);
plot(t,y);
function [t,y]=integrateWithEvent(fn, tstart, tstop, y0, event, onEvent)
t=[];
y=[];
tStart=tstart;
while true
[tPrime, yPrime]=ode45(fn, [tStart, tstop], y0, odeset('Events',event));
t=[t;tPrime];
y=[y;yPrime];
num=length(tPrime);
y0=yPrime(num,:);
if (tPrime(num)>=tstop)
break;
else
tStart=tPrime(num);
y0=onEvent(tStart,y0);
end
end
end
% resets y to zero whenever the event occurs
function result=myOnEvent(t,y)
result=0;
end
function dy=theOde(t,y)
dy=y+1;
end
function [value,isterminal,direction]=myEvent(t,y)
value=y-4;
direction=1;
isterminal=1;
end
end
Parallel Computing
Matlab supports parallel computing via the Parallel Computing Toolbox. We consider the simplest case: performing the same calculation on different sets of data. Use the matlabpool command to connect to a pool of Matlab workers. The default is to create workers on the local machine, however with the appropriate setup, the workers can also be spread across a cluster. Now replace your for loop with a parfor loop, as in parForDemo.m. For maximum compatibility, we check for the parallel computing toolbox and provide a for loop as a fallback. Each worker in the example prints its id; different runs will display the numbers in different sequences.The demo code compares linear, quadratic, and cubic growth. A title, legend, and axis labels are provided. The y-axis is also scaled manually.
function parForDemo
% check for parallel computing toolbox
supportsParallel=false;
try
sizePool=matlabpool('size');
supportsParallel=true;
if sizePool==0
disp('Warning: It looks like your computer has the parallel computing')
disp('toolbox, but no parallel pool is available. Type ''matlabpool''')
disp('to start a pool to enable faster basin of attractions calculations');
end
catch
end
% setup for the calculation
x=linspace(0,5);
y=zeros(length(x),3);
% the calculation.
if supportsParallel
parfor i=1:3
disp(i);
y(:,i)=x.^i;
end
else
for i=1:3
disp(i);
y(:,i)=x.^i;
end
end
plot(x, y(:,1), 'red', x, y(:,2), 'blue', x, y(:,3), 'black');
title('Comparison of growth rates');
legend('linear', 'quadratic', 'cubic');
xlabel('x');
ylabel('y');
ylim([0 50]); % set the y-range
end